Interpreting the shape of the flow-volume loop

Flow-volume loops do not form a part of the 2017 CICM Part I syllabus document and are not mentioned in the CICM "Ventilation" WCA. However, Section F3(v) from the 2017 CICM Primary Syllabus expects the exam candidates to "describe the pressure flow and flow volume relationships of the lung", which sounds suspiciously loopy. It is not clear whether this material belongs here (in the Deranged Physiology mechanical ventilator section) or how it fits in the training program as a whole, but it cretainly seems relevant. Also, the Part II exam contains some SAQs regarding loop interpretation, and therefore there is a brief summary available over there, to help the Fellowship candidate remember these things they never learned.
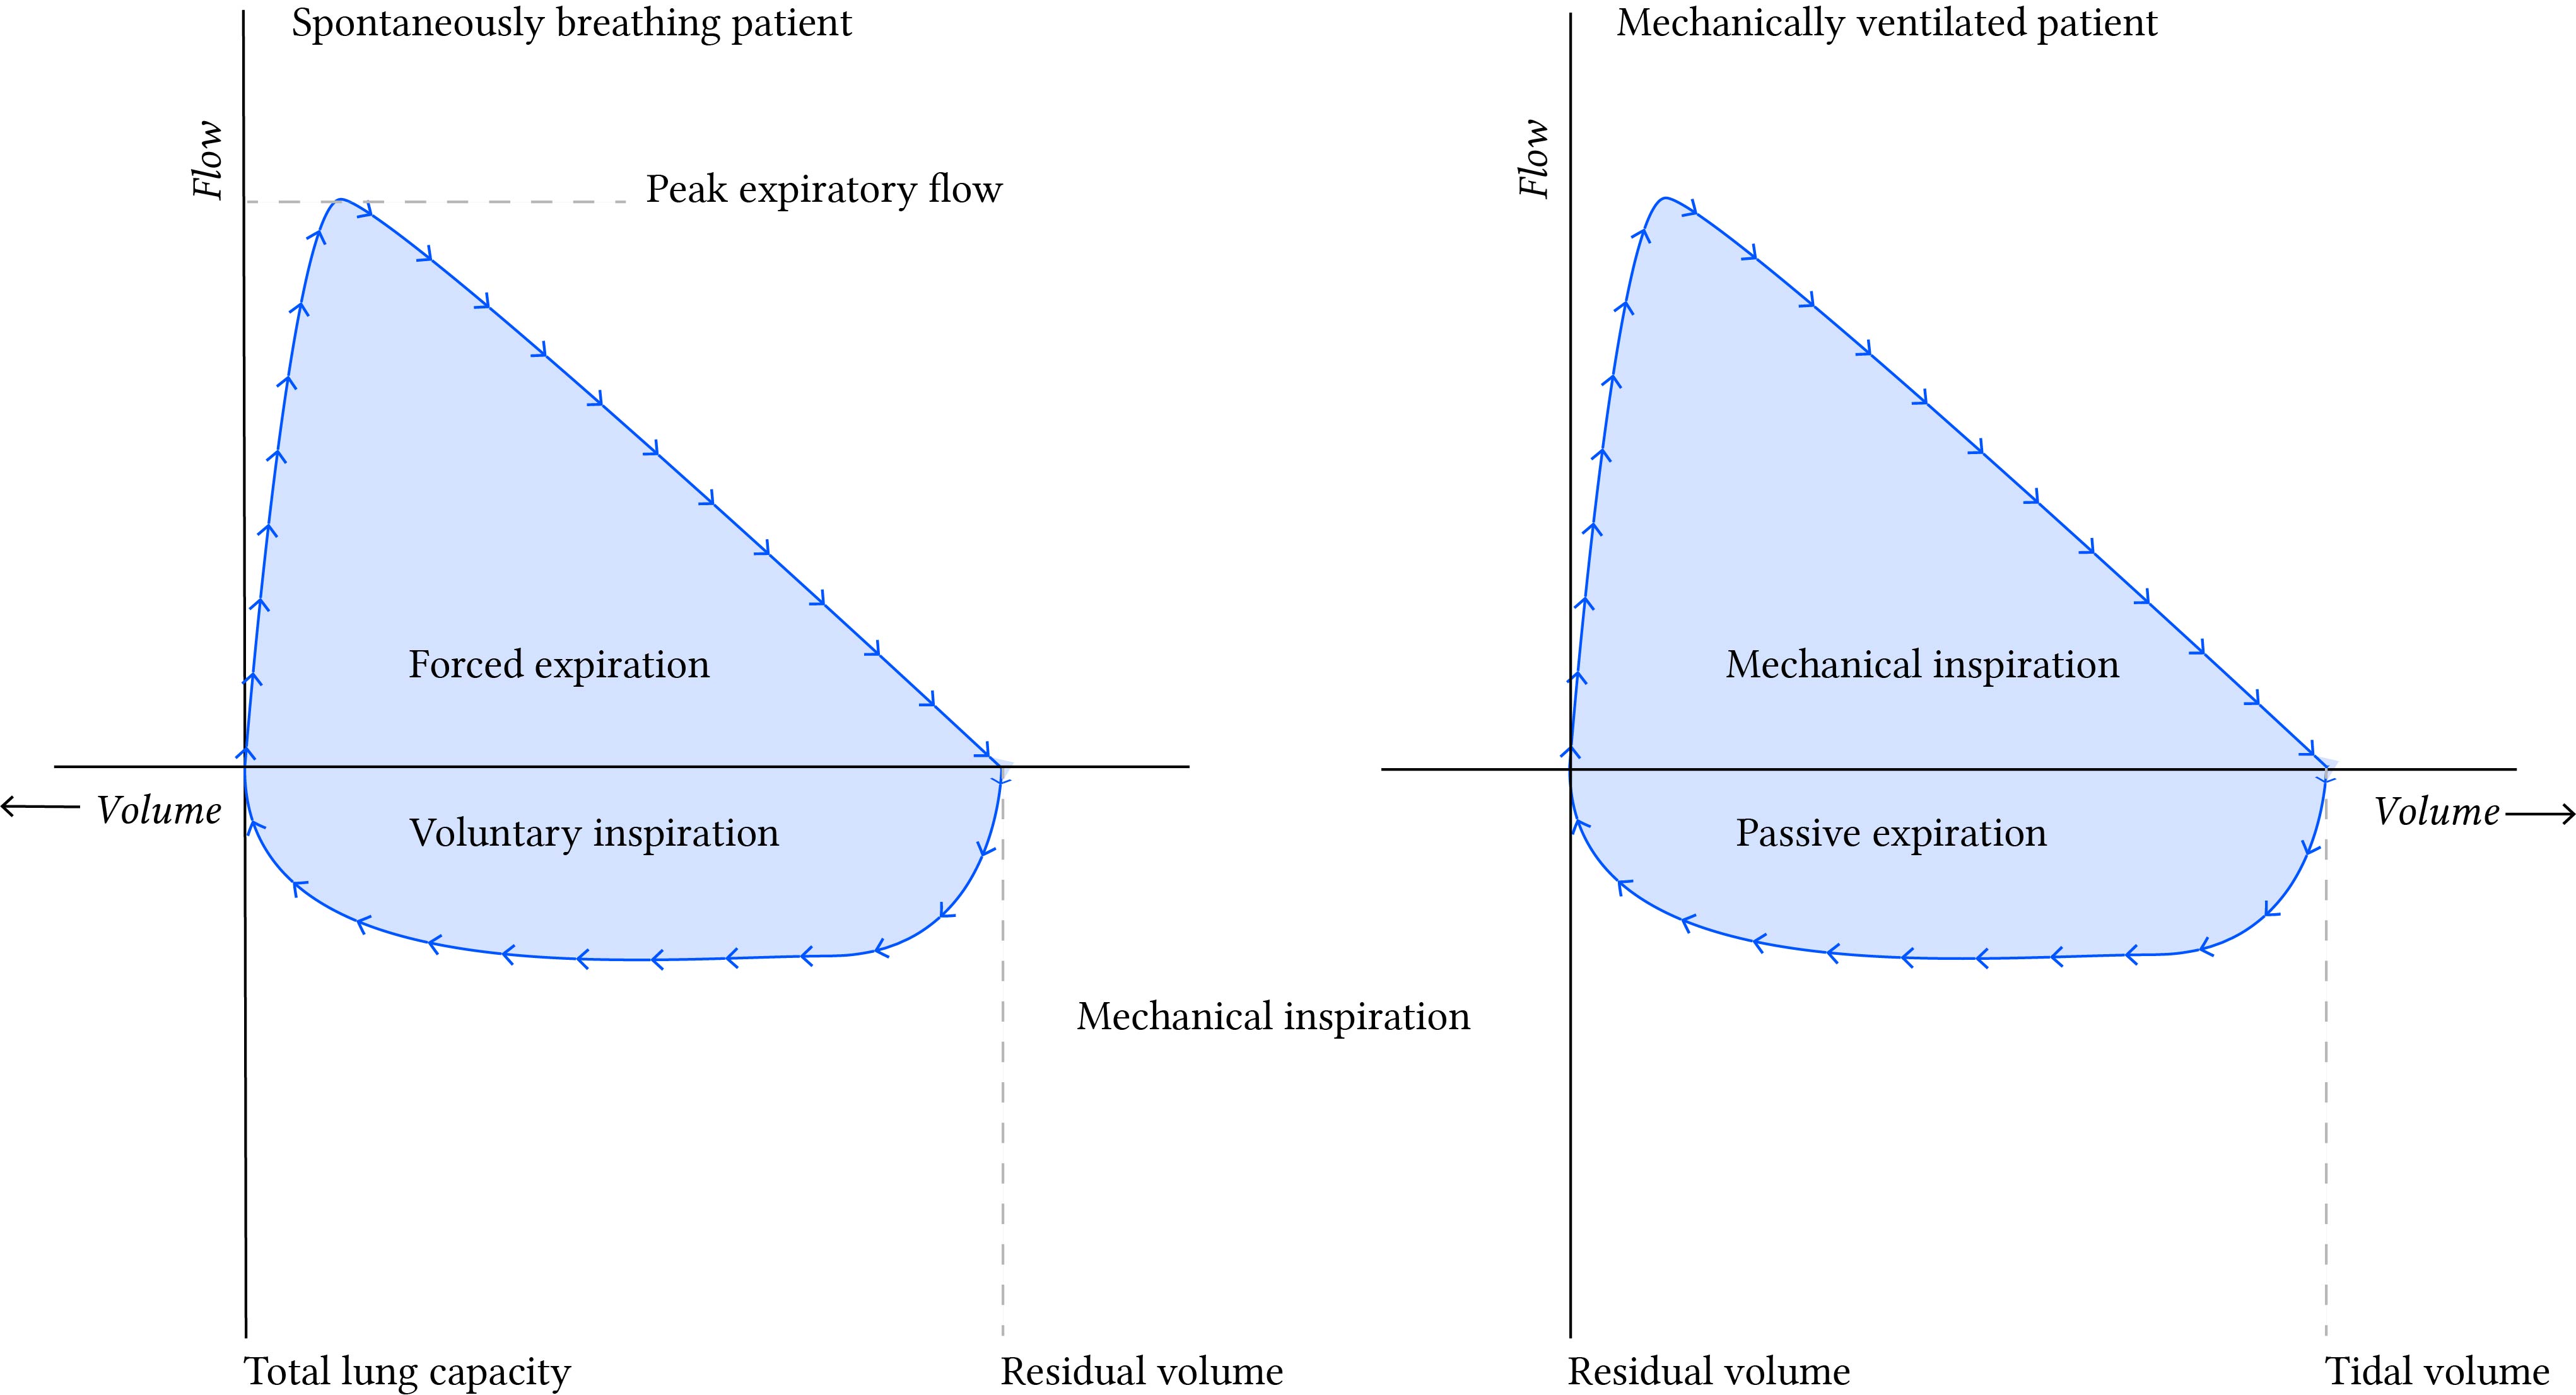
Typically, when one thinks of flow-volume loops, one refers to the classical loops of forced expiratory spirometry. Most of what is written about flow-volume loops refers to these. Indeed, both the LITFL entry on flow-volume loops and the AnaesthesiaUK revision article use the formal pulmonary function test standard of flow-volume loop interpretation.
As you can see, the shape of the curves is quite similar, but the fundamental difference is in the fact that in the ventilator loop is by convention upside-down, and the volume measurements on the x axis measure in opposite directions.
![]()
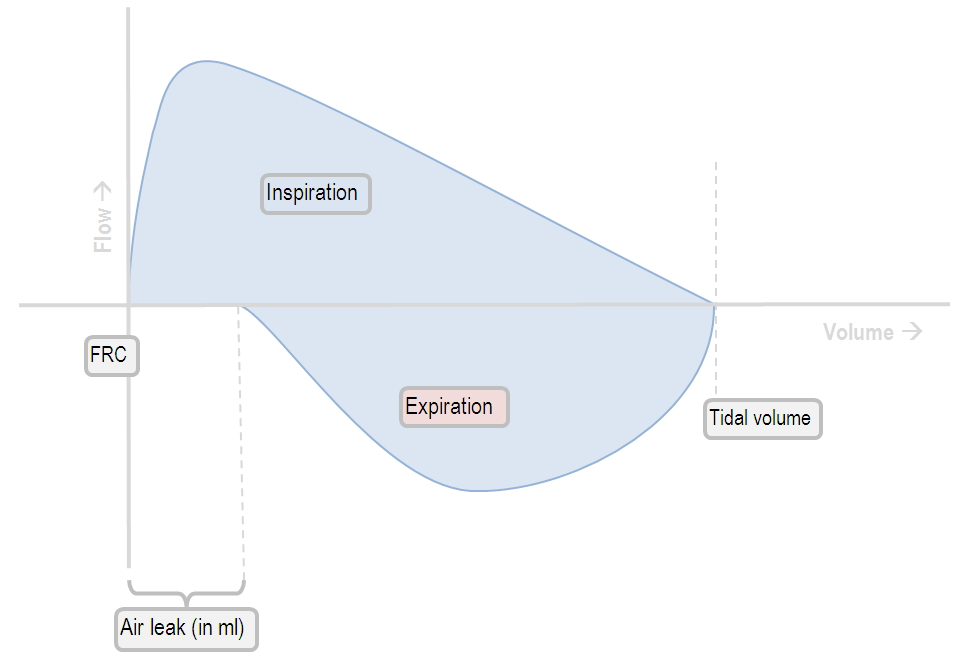
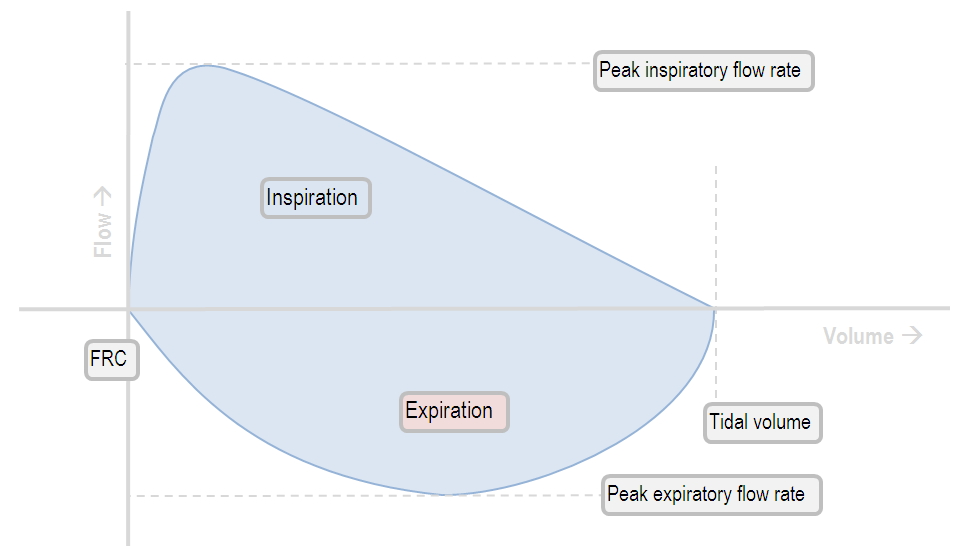
The turbine gives rise to a controllable and adjustable inspiratory flow (you can have whatever flow pattern you want!). The inspiratory flow part of the loop is therefore more reflective of lung compliance: as the lung distends, the flow decreases. Then, the patient exhales passively; here airway resistance will be revealed as the determinant of expiratory flow rate.
With the classical spirometer, the patient forcibly exhales into the machine; the peak expiratory flow rate and the shape of the expiratory flow-volume curve is therefore the best measure of airway resistance.
Normal flow-volume loops
Flow-volume loops in obstructive lung disease
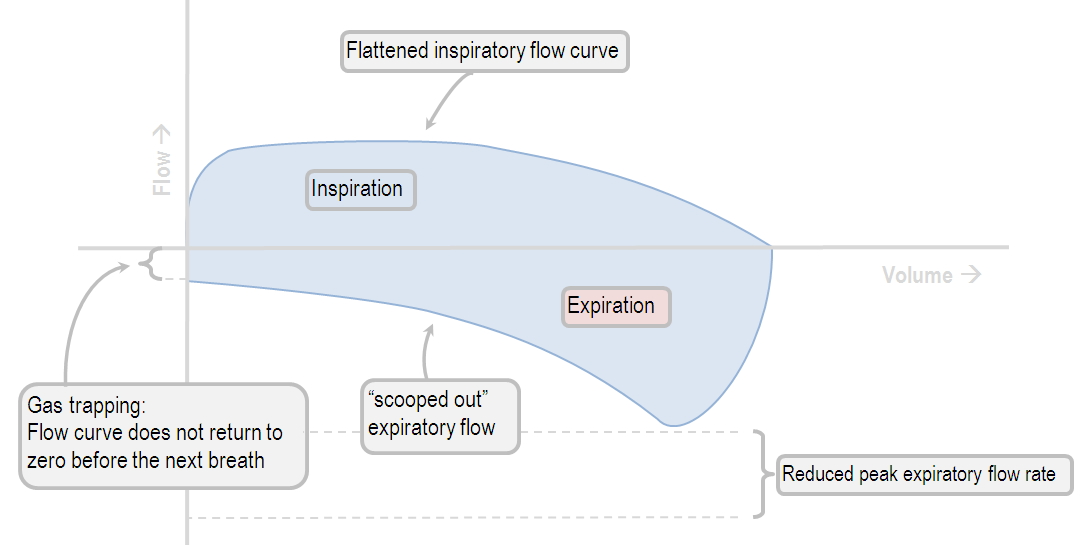
Characteristic features of obstructive lung disease in the flow-volume loop include the following:
Low peak inspiratory flow
Low peak expiratory flow
Failure of the expiratory flow curve to reach zero (an "open loop")
A "scooped out" expiratory flow pattern
Flow-volume loops in restrictive lung disease
If the restrictive disease did nothing but reduce the volume of the lung, the curve would look rather normal, but diminished in size, as depicted below.
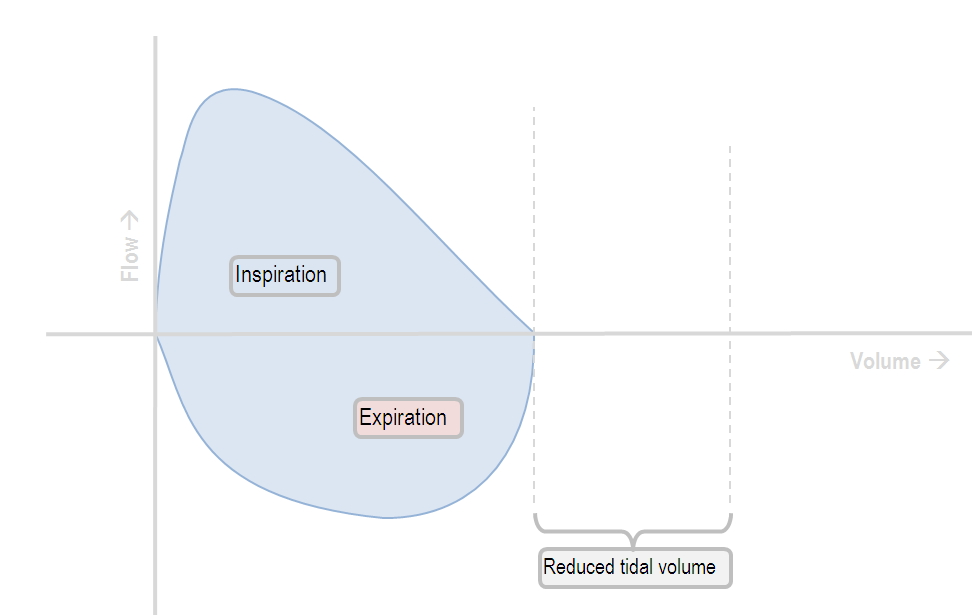
However, usually the lung disease also causes a decrease in lung compliance.
The curve assumes a different shape:
Characteristic features of restrictive lung disease in the flow-volume loop include the following:
Low tidal volume
Rapid decrease in inspiratory flow
Rapid expiratory flow, with a high peak expiratory flow rate (as the inelastic lung recoils)
The effects of a circuit leak on flow-volume loops
