The shape of the pressure waveform

In the presence of constant-flow, the pressure waveform can give one information about the compliance of the different parts of the respiratory system. The waveform which is of greatest interest is the one generated when you put the patient on a mode of ventilation which features a constant inspiratory flow, such as a volume controlled mode of ventilation. In the presence of constant flow, the waveform represents the change in circuit pressure over time. Obviously, if the flow is not constant, the pressure waveform will be almost completely uninformative. It then becomes something of an indicator of patient-ventilator dyssynchrony.
The idealised waveform depicted here is for a constant flow volume-controlled mode, with an inspiratory pause (without the pause some of the more interesting components would not be revealed)
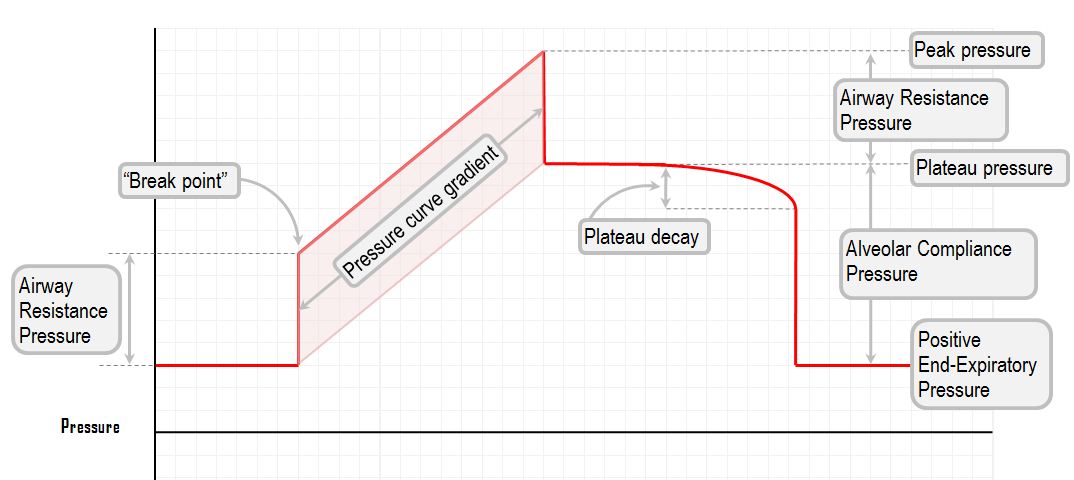
Peak pressure
This is the maximum pressure generated in the circuit.

A rising peak pressure alerts one to the possibility of airway narrowing in some sense, be it the endotracheal tube being kinked (or chewed on), or the ventilator tubing being full of fluid, or the heat and moisture exchanger being waterlogged, or the secretions building up on the inside of the endotracheal tube. Or, the patient might actually be having some sort of bronchospasm.
Airway resistance pressure
This is the pressure produced by the resistance of the whole circuit (the hoses, the endotracheal tube, and the patients own bronchi)

This pressure is only present while flow is occurring. It relates directly to the "dynamic" compliance of the chest. As soon as flow stops, the pressure due to airway resistance drops to zero. Thus, one can estimate the airway pressure (and thus the degree of airway resistance) from the difference between peak pressure and plateau pressure.
Break point

This is the point at which the airway resistance pressure has been overcome, and the lungs begin to fill with air. The break point is determined by the airway resistance pressure. Thus, the higher the flow, the higher the break point. Also, the higher the airway resistance, the higher the break point. It is very rarely quite as clear cut as these idealised diagrams would suggest. Typically a break point is a subtle change of the curvature, where the gradient of the pressure curve changes.
Plateau pressure: alveolar compliance pressure
This is the pressure in the lung after all flow has stopped. It is the alveolar pressure generated by the delivered volume. It is directly related to the compliance of the lung parenchyma, the "static" compliance.

"Plateau decay" is the slight drop in pressure during an inspiratory breath hold. It occurs because of the redistribution of gas between different lung units, as well as because of small leaks in the circuit (around the cuff and various tube connections).

Plateau pressure is for all intents and purposes the pressure inside the alveoli. This is the pressure you would need to alter to improve oxygenation. One can predict that when compliance is poor, plateau pressure will be high, and the pressure gradient will be steep. A plateau pressure of over 30 cm H2O is uniformly thought to be harmful, and should be avoided.
Plateau decay
If you introduce a pause after the end of inspiration, the pressure will gradually drift down from its initial plateau pressure. This is happening for a number of reasons:
The elastic energy stored in the lung tissue and chest wall is dissipating (this is "tissue resistance")
Lung units with different time constants are exchanging gas
Some of the gas is being absorbed into the pulmonary circulation
Some of the gas is leaking out of your (no doubt, imperfect) circuit tubing
Pressure curve gradient
This is the rate of pressure rise. Again, it depends on the rate of inspiratory flow.

Because the ventilator flow is a controlled known variable, this gradient represents the compliance of the lungs. Compliance is the change in volume per unit pressure; flow is change volume per unit time. In a patient with poor compliance, a smaller change in volume will lead to a greater change in pressure, and the gradient will be steeper.